What's the new multicolor bar on Stall Catchers?

Hello hello ! Here to share and explain an exciting update on the main Stall Catchers interface.. :)
The new "tribar"
You might have noticed a progress bar like this right at the top right of the screen:

We call it a "tribar" :) Why? because it has three colors that represent completion of three separate phases of our data analysis in Stall Catchers.
Yellow -- % of dataset analyzed
Green -- % of dataset validated
Blue -- % of dataset verified
######What is "analyse, validate, verify"?
The analysis of each dataset in Stall Catchers occurs in three phases: we collect a first pass of crowd answers for all vessels in a dataset before beginning a second pass, and a second pass on all vessels before we begin a third pass.
E.g. if there are 3000 vessel movies in a dataset, we will first make sure all 3000 have one answer (first pass), then start phase two, collecting a second answer for all 3000 movies (second pass), and then start phase three, collecting a third answer for all moves (third pass).
Note: we actually use dynamic stopping rules, and sometimes a movie will require fewer or more answers to get a confident crowd result (depending on the sensitivity of catchers who analyzed it) but it's usually around 3-4 answers, and would be taken care of in phase three.
In each successive pass, we develop greater confidence in our research results until after the final pass we know that with 95% probability we have met the Lab's stringent data quality criteria.
We decided to represent this layered approach to data collection on the interface via a "tribar" progress indicator that breaks down the analysis into three phases: "Analyze", "Validate", and "Verify" -- first pass, second pass, and third pass.
######What do the colors mean? The three colors therefore each represent completion of the three phases. Once the bar fills up with yellow -- means the dataset is 100% *analyzed*, green -- *validated*, and blue -- *verified*.
Once analysis phase is complete, and the yellow bar is full, it stays yellow, while the green bar -- validation phase -- fills on top of it. Once it's 100% green, it stays green, and the blue one -- verification phase -- fills on top of the green. 100% blue bar means the dataset is complete.
Like so:
 Yellow bar 61.2% full
Dataset fully analyzed, started validation:
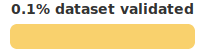 Yellow bar 100% full, green bar 0.1% full
Dataset partially validated:
Yellow bar 100% full, green bar 35.2% full
That way you can follow the progress of each dataset -- and each stage of the analysis, right on the game, in real time!
######What does it mean for the research? Once the yellow bar is 100% full, we might have enough data to provide a preliminary result, with subsequent passes either strengthening or adjusting those results. Sometimes we might wait for validation and/or verification to be complete before looking into it, but other times it might be useful to look into the preliminary result early.
This mirrors exactly what scientists often do in the laboratory when they take an early snapshot to see if the results are moving in the expected direction.
We would have higher confidence answers after the validation, and can be confident (with 95% probability) of the accuracy of the crowd answers after the verification, at which time we would look at the final results and give the data to our biomedical collaborators at Cornell. They themselves would look at all the stalls that the crowd has identified, carry their own validation of these results, and draw the relevant conclusions. Which we would then report back to you!
So that's that. Enjoy!
And please give us feedback if you think this "tribar" could be improved in any way... :)